Configuration Manager Client Health Report
This report contains both summary and detailed data about the health of devices in your ConfigMgr environment. It is a Microsoft Excel report that uses SQL data connections to your ConfigMgr database. Minimum software requirements are Microsoft Excel 2010 and System Center Configuration Manager 2012.
Download
Download the report here.
Configure
Follow the instructions here to configure the report for use in your environment
Overview
Monitoring and maintaining the health of your clients is an important task for any ConfigMgr administrator. This report aims to gather important data about the health of your clients, with an ‘at-a-glance’ summary sheet, charts that represent key data graphically, and several data-table worksheets that contain the full list of clients in your environment in their different health states. Much of the data in the report can be found in various places in the ConfigMgr console, or in the SSRS reports, but this report brings all this data into one place for simplicity and convenience.
Summary Sheet
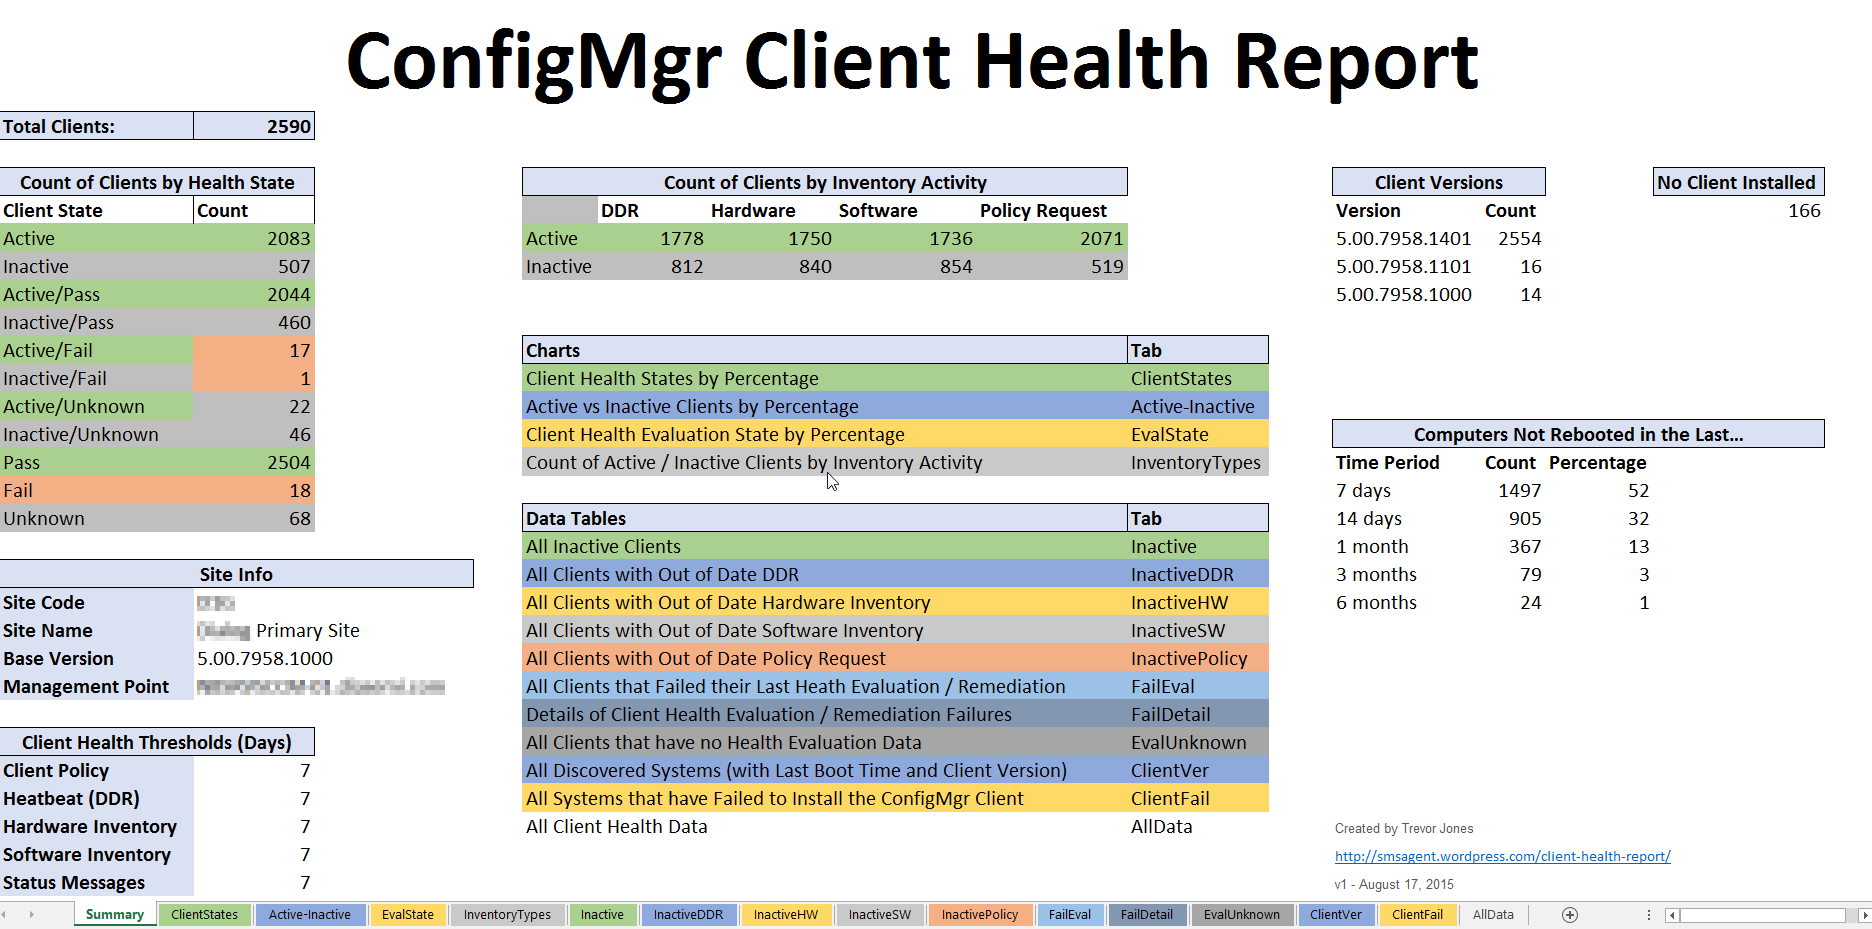
On the Summary worksheet, you will find some key data relevant to client health.
Total Client Count
First, we have the total number of ConfigMgr clients in your site database.

Count of Clients by Health State
We have a count of the number of clients in their various health states. The health states indicate whether a client is active or inactive, and whether the client has passed the client evaluation check.
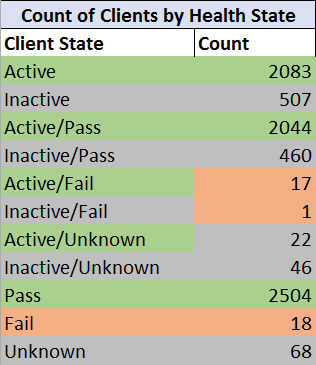
A client is marked as active if it reports activity within the thresholds defined in your Client Status Settings, for any of the defined settings, including Client Policy request, Heartbeat discovery (DDR), Hardware inventory, Software inventory and Status messages. If the client has reported no activity within the thresholds in any of the settings, then it is marked as inactive.
The Client Status setting thresholds are defined in the ConfigMgr Console, under Monitoring > Client Status > Client Status Settings (in the ribbon).
The client health evaluation is a scheduled task that runs on each ConfigMgr client and starts the program “ccmeval.exe”, which performs various checks on the health of the ConfigMgr client and the things that support it, such as WMI and BITS etc. If all the checks pass, then the client is considered healthy. If any check fails, remediation may be attempted (this can be disabled if required). If remediation fails, the client is considered unhealthy. In the event that there are no results returned for the client health evaluation, it will have the status “Unknown”.
Ideally, all your ConfigMgr clients should be in the Active/Pass state, although stale computer accounts in Active Directory, stale records in the ConfigMgr database, extended employee absence, and other factors can all affect the count. Any machine in the ‘Active/Fail‘ state should be investigated, as should any machine in the ‘Active/Unknown‘ state.
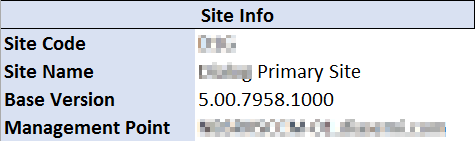
Site Info
Here we have some basic info for your ConfigMgr site, which comes from the v_Site database view. The base version does not represent the current CU level.
Client Health Thresholds
These are the thresholds (in days) that have been configured in the Client Status settings for your site.
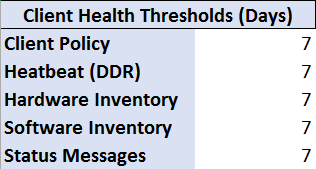
If any client has not reported activity for a particular setting within the threshold defined, it is considered inactive for that setting. The client itself will still be considered active if it has reported activity within the threshold for any of the other settings.
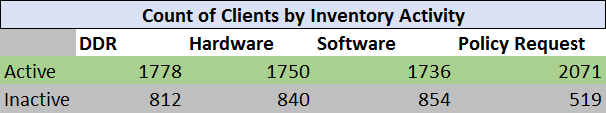
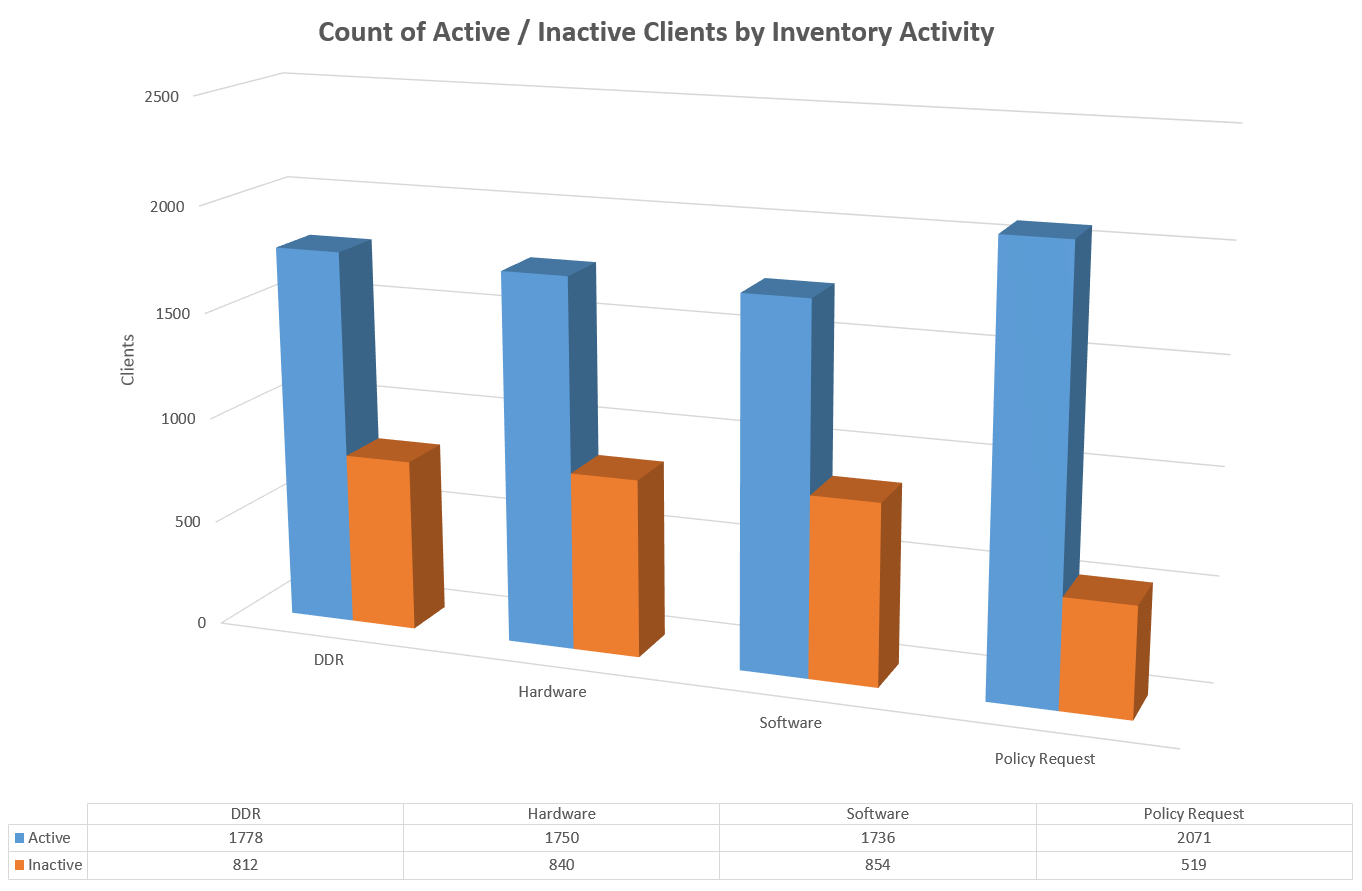
Count of Clients by Inventory Activity
This is a count of all clients that are reporting either active or inactive for each of the Client Status settings (except status messages).
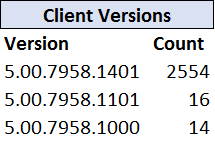
Client Versions
This is a count of clients by the ConfigMgr client version installed. It will report up to 6 different versions in the summary.
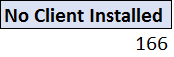
No Client Installed
This is a count of the number of discovered systems that have a record in the ConfigMgr database, but do not have the ConfigMgr client installed.
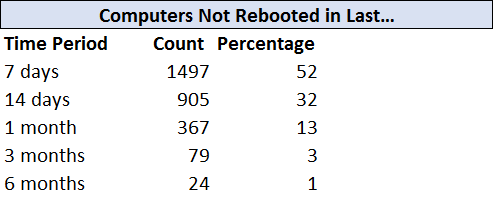
Computers Not Rebooted
Ensuring that computers are regularly restarted is an important part of maintaining client health, especially when ConfigMgr is used for software installations and software update installations, as in many cases a machine will not report compliant until it has been restarted. Here we list the number of machines that have not been restarted in the time period specified.
 Charts and Data Tables
Finally, we have a listing of all the charts and data tables in the report, referencing the description with the name on the corresponding worksheet tab.
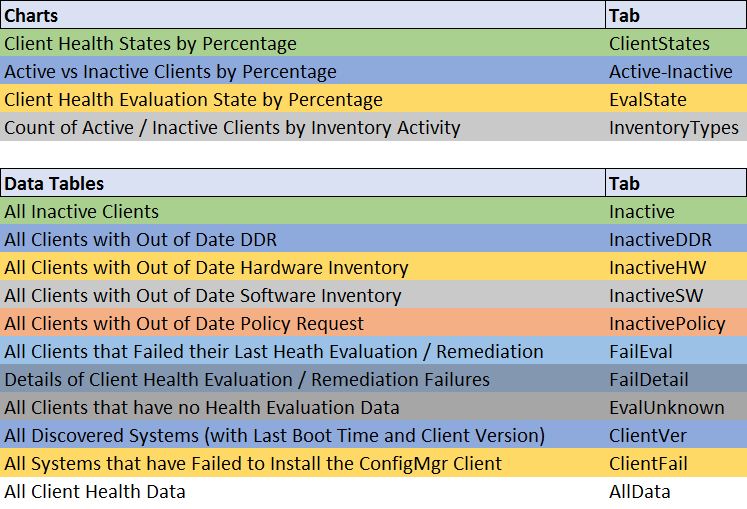
Charts
The report contains the following charts for a quick visual indicator:
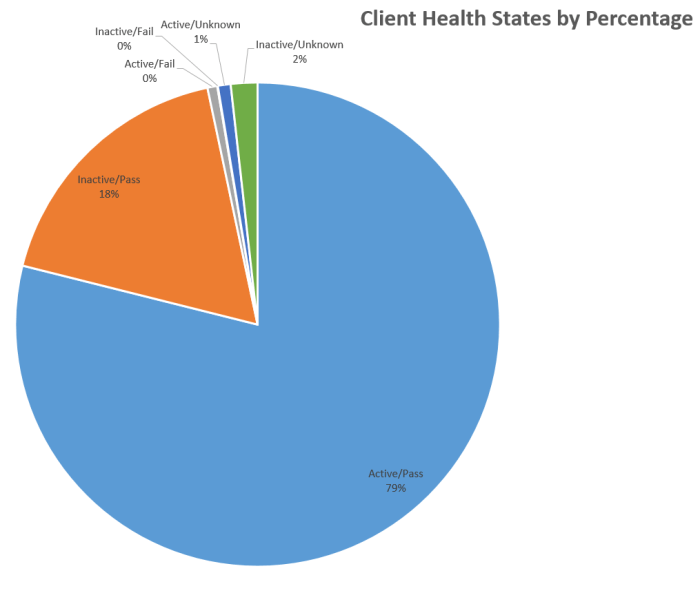
Client Health States by Percentage
This chart displays clients by percentage in their various health states. In a healthy environment, the Active/Pass state should be the vast majority!
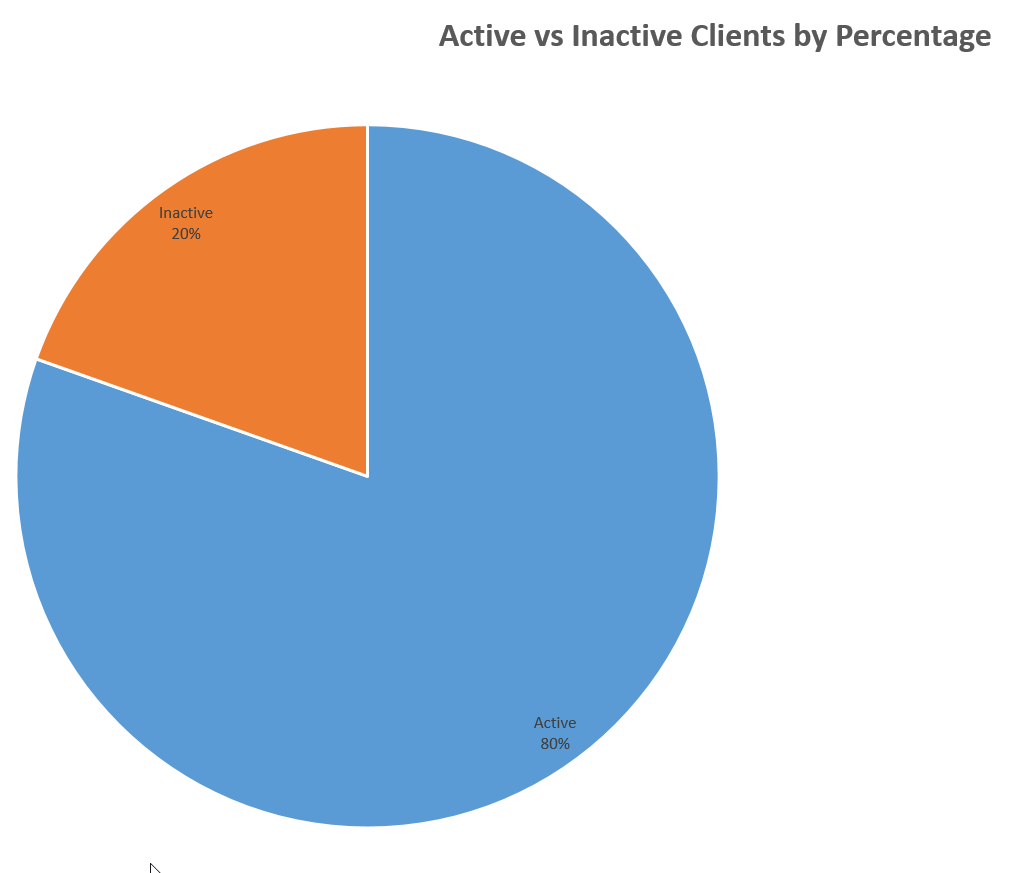
 Active vs Inactive Clients by Percentage

This chart displays the active and inactive clients as a percentage of the overall client count.
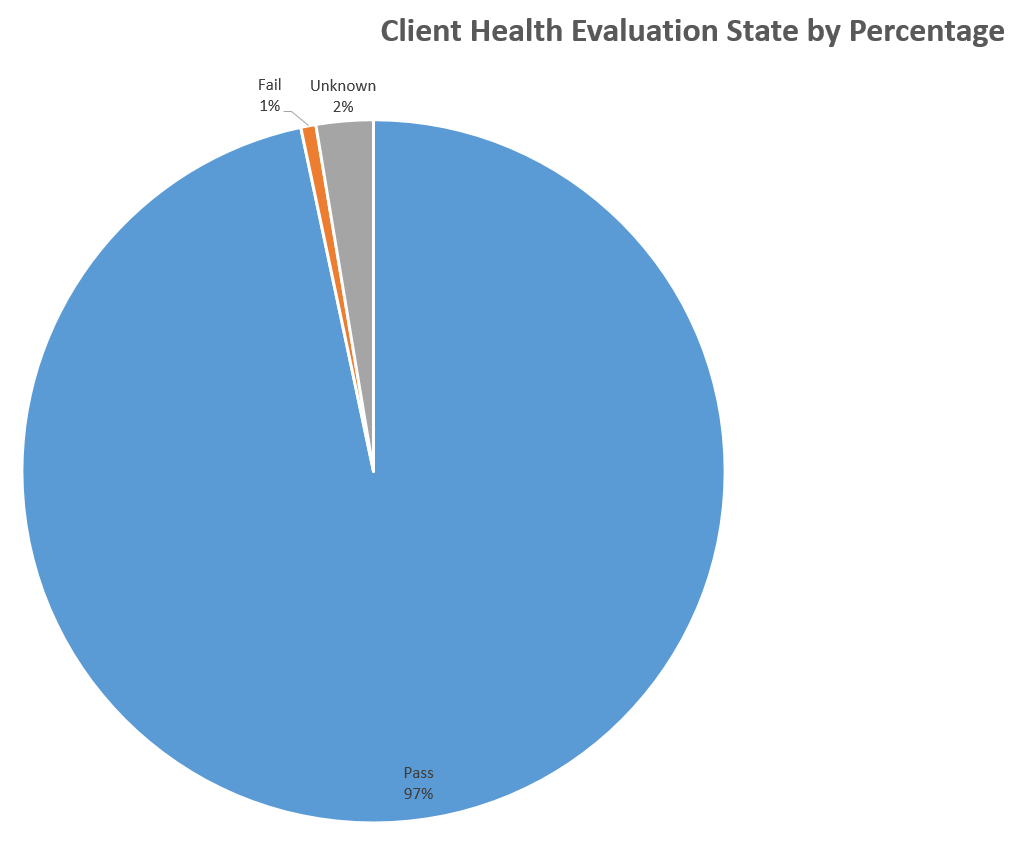
 Client Health Evaluation State by Percentage
This chart displays clients in their health evaluation state, as a percentage of the overall client count.
Count of Active / Inactive Clients by Inventory Activity
This charts displays the count of clients that are either active or inactive, according to the thresholds you have set, for each of the different client status settings.
 Data Tables
The report contains several data tables that list every client in each of the various health states, for quick reference and troubleshooting. Much of the data comes from the v_CH_ClientSummary database view, which contains numerous columns useful to client health reporting and troubleshooting, such as:
- ClientStateDescription
- ClientActiveStatus
- LastActiveTime
- IsActiveDDR
- IsActiveHW
- IsActiveSW
- IsActivePolicyRequest
- IsActiveStatusMessages
- LastOnline
- LastDDR
- LastHW
- LastSW
- LastPolicyRequest
- LastStatusMessage
- LastHealthEvaluation
- LastHealthEvaluationResult
- LastEvaluationHealthy
- ClientRemediationSuccess
- ExpectedNextPolicyRequest
Using Excel’s filtering capability, we can filter for clients in specific states or that reported results in specific time periods etc.
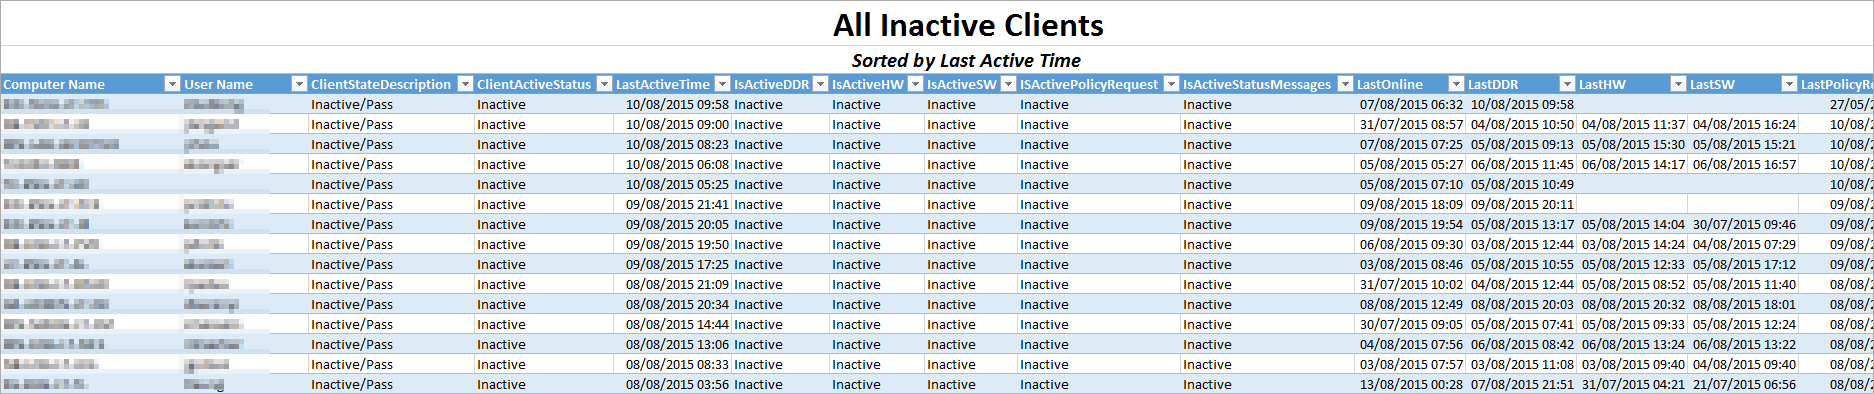
All Inactive Clients
All clients in an Inactive state, sorted by the last active time.
All Clients with Out of Data DDR
All clients that have exceeded the threshold set for DDR (heartbeat discovery), sorted by the last DDR date.
All Clients with Out of Date Hardware Inventory
All clients that have exceeded the threshold set for Hardware inventory, sorted by the last hardware inventory date
All Clients with Out of Date Software Inventory
All clients that have exceeded the threshold set for Software inventory, sorted by the last software inventory date
All Clients with Out of Date Policy Request
All clients that have exceeded the threshold set for Policy Requests, sorted by the last policy request date
All Clients that Failed their Last Health Evaluation / Remediation
This table lists all clients that are in the “fail” state for client health evaluation. These clients did not successfully complete the health evaluation or remediation, and should be investigated. The table contains the same fields as the previous tables.
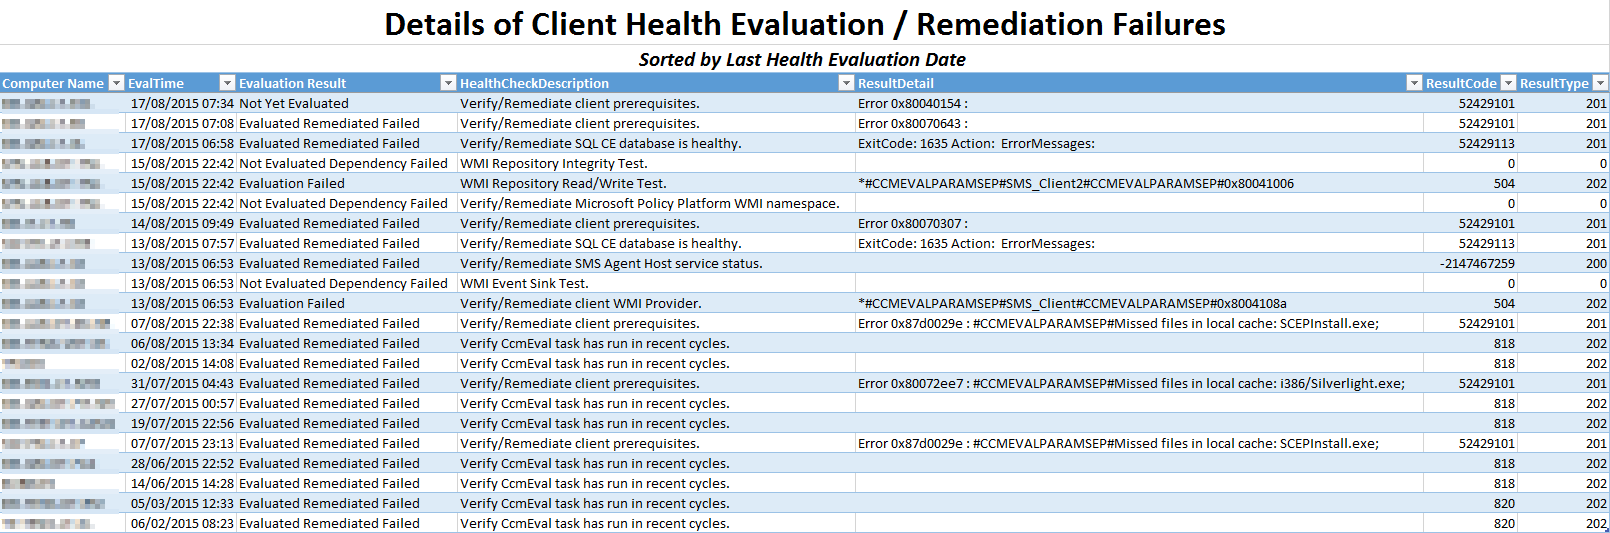
Details of Client Health Evaluation / Remediation Failures
This table contains the same list of clients as the previous table, but gives the details of which evaluation check or remediation task failed, together with any error code or error description reported, which is helpful for quick troubleshooting.
All Clients that have No Health Evaluation Data
Lists all clients in the “Unknown” state that have not reported any health evaluation data. This could represent machines that have not yet run the client evaluation task, or where the task has not been installed correctly, or is not functioning correctly, for example. At least the active and online machines should be investigated.
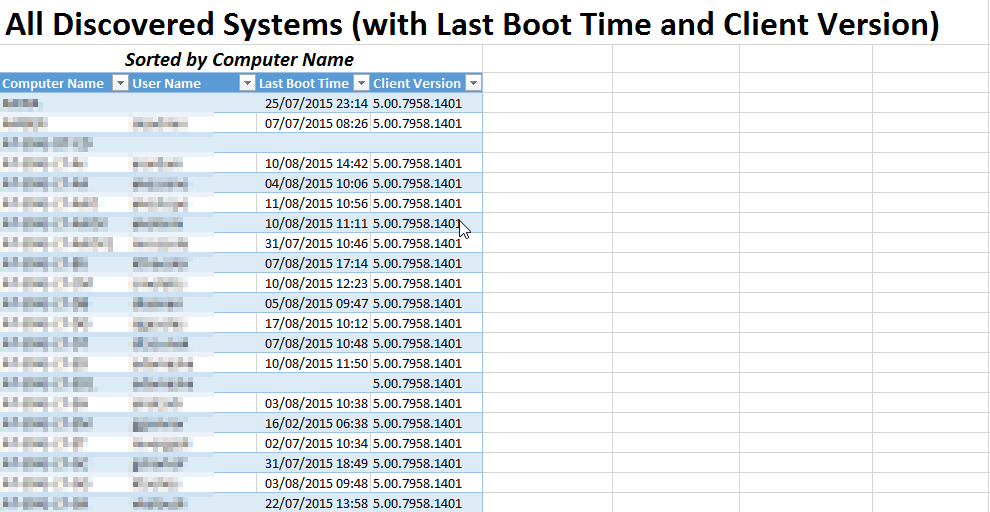
All Discovered Systems (with Last Boot Time and Client Version)
This table will enable you to find the last boot time of any client, from the current hardware inventory data in the database, or filter for a list of machines that haven’t rebooted in a given time period. You can filter for any client that is not at the current CU level for your environment. You can also filter for blanks in the Client Version column to identify systems that have been discovered and have records in the database, but do not have the ConfigMgr client installed.
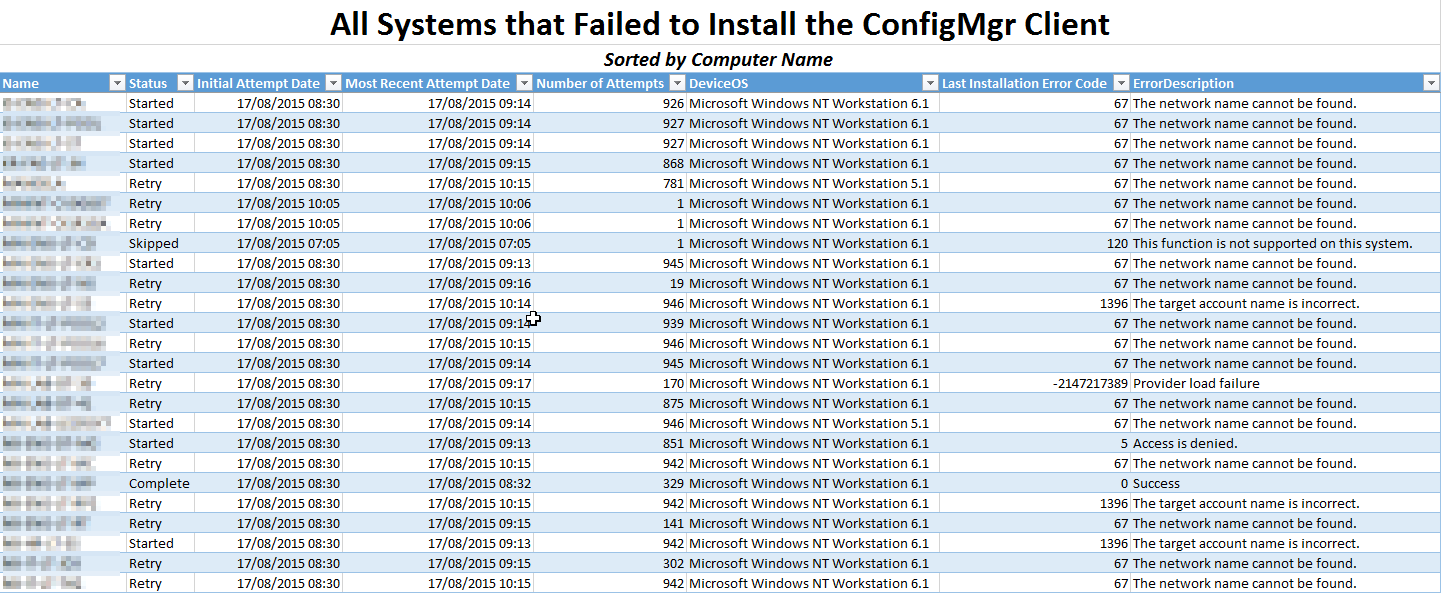
All Systems that Failed to Install the ConfigMgr Client
This table lists all machines where ConfigMgr has tried to install the client, but has not been able to do so successfully. You can see, for example, the number of attempts ConfigMgr has had at trying to install the client (using client push installation), when was the most recent attempt, and what is it’s current status.
You can also see the error code. To translate the error code to it’s more friendly error description, you can use the script I published here. Or, if you want to include the error descriptions in the report as you can see in the screenshot, you can create a database of error codes and descriptions, and link to it in the SQL query. To do that, follow the instructions here to create the database, then change the “Client Install Failures” data connection in the report to use the SQL query below. This will join the error codes to their descriptions, and add them to the report.
Once you have the error codes translated, you can better understand why the installations are failing. For example, error code 67 translates to “The network name cannot be found”, which usually indicates the machine is offline, or the host name could not be resolved to an IP address. Sometimes you may see a machine that has the status “Complete” and the error code 0, which indicates success, but if the machine is in this list, then it either does not have the ConfigMgr client installed, or it has failed to register with the management point, and should be investigated.
SQL Query
select cdr.Name,
cdr.CP_Status as 'Status' ,
cp.InitialRequestDate as 'Initial Attempt Date' ,
cdr.CP_LatestProcessingAttempt as 'Most Recent Attempt Date',
cp.NumProcessAttempts as 'Number of Attempts',
cdr.DeviceOS,
cdr.CP_LastInstallationError as 'Last Installation Error Code',
err.ErrorDescription
from v_CombinedDeviceResources cdr
inner join v_CP_Machine cp on cdr.MachineID = cp.MachineID
left join ErrorCodes.dbo.WindowsErrorCodes err on cdr.CP_LastInstallationError = err.SignedInteger
where
cdr.IsClient = 0
and cdr.DeviceOS like '%Windows%'
order by cdr.Name
All Client Health Data
Finally, this table contains all ConfigMgr clients whatever their health status, and can be used to filter for machines according to your own custom filtering requirements. For example, if you want to quickly find the client health status of a particular machine, simply filter for it in the Computer Name column.
Happy reporting!
Hello, I would like to incorporate a modified version of one of your SQL queries contained within this spreadsheet into a Powershell script I wrote designed to check client health versus active accounts in AD. Is it okay if I republish that query? I will be sure to credit you with a link back.
By all means 🙂
Much thanks!
Hi Trevor
First of all thank you for sharing a fantastic report. Saves a lot of our time .
Just one question – Is there any way we can narrow down our search based on collection instead of Entire Database ?
Currently its searching Entire database and I am getting 100’s of entries which I don’t need .
It would be really helpful if you can bring it down to collection instead of entire database.
Thanks
HI Trevor, Is it possible to export the data from SCCM SQL database and then import that data in your Excel worksheet? My company doesn’t allow Excel on servers. thanks in advance