
ConfigMgr Deployment Reporter is a free application that uses your System Center Configuration Manager database to report on the status of your deployments. It can report on application, package, compliance baseline, software update and task sequence deployments. As well as giving an overview of the current deployment status, it gives the details of all machines in each compliance state for the deployment, and allows you to create charts, HTML deployment reports and export deployment results to CSV format.
ConfigMgr Deployment Reporter is based on the Deployments node of the ConfigMgr console but in a re-imagined format allowing you to select which deployment “feature type” (ie application, package/program etc) you want to report on, as well as which targeted collection, and where applicable, which deployment type. Full details of the status of each system targeted by the deployment can be easily viewed by selecting the relevant tab, such as Compliant, In Progress etc. Deployment results can be exported to CSV format at the click of a button, allowing easy filtering or searching.

Deployment status overview is split between applicable systems and reporting systems, where applicable systems includes all assets targeted by the deployment and reporting systems includes only those assets that have reported status to ConfigMgr. This separation allows for a more accurate picture of the success of the deployment as it progresses. Status overview is calculated from current deployment results rather than summarization data for more accurate, real-time results.
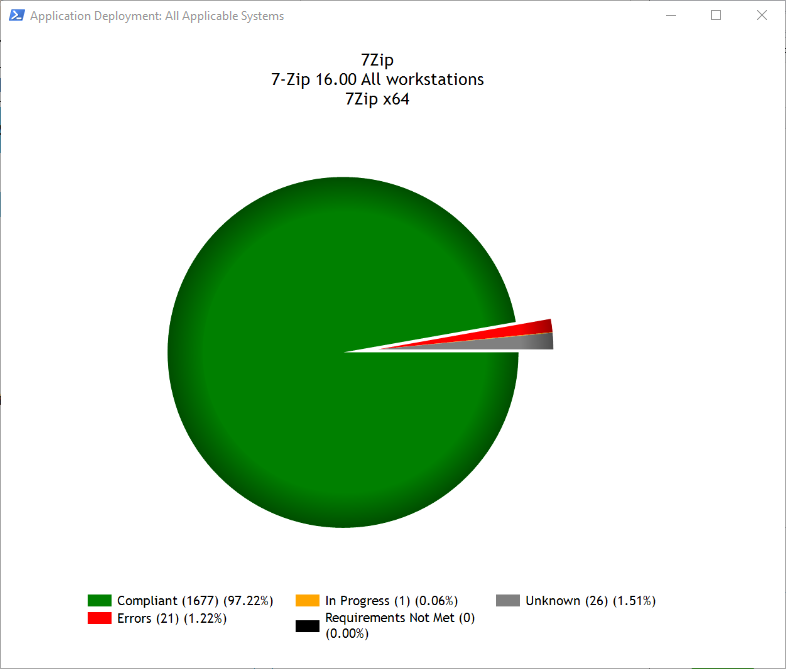
Charts can be instantly generated at the click of a button, allowing a graphical view of the deployment status.
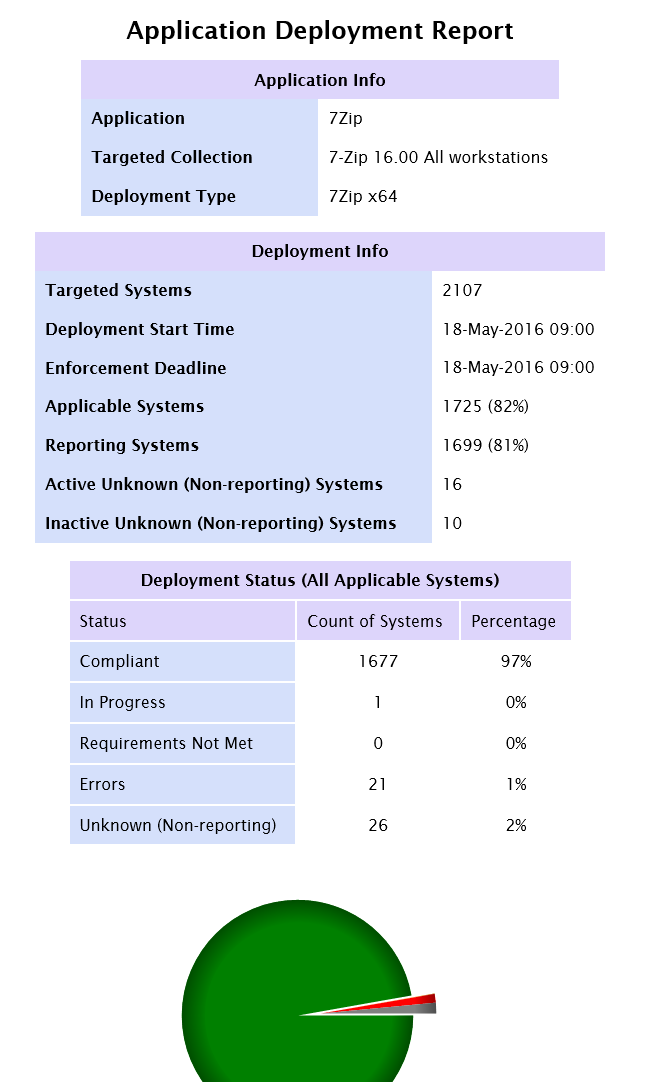
HTML reports can also be generated at the click of a button from the current deployment results, creating a nice overview of the current deployment status that can be sent to interested parties as an html file, or hosted on a website.
Download
ConfigMgr Deployment Reporter can be downloaded here.
Requirements
Interestingly my code analyzer tells me it should work with PowerShell version 2, but in reality PowerShell 5 is needed.
Setup
ConfigMgr Database
After installing the application and running it for the first time, the application will open to the Settings flyout, where you will need to enter the SQL server and database details for your ConfigMgr database. You will need a minimum of db_datareader SQL role on the database.
Error Code Translation
You also have the option to enable translation of error codes to their more friendly descriptions. When systems are in an error state for a deployment, they report an error code which is saved to the ConfigMgr database in the deployment results. This is applicable for application, compliance baseline and software update deployments. In the ConfigMgr Console Deployments node, this error code is translated to its friendly name using an internal process. Since this is a standalone application, error codes can be translated by creating a database of error codes in your ConfigMgr SQL instance. Once created, enabling this option allows the application to reference this database and translate error codes for you into their more friendly, and more useful form.
Creation of the database is easy, and is a one-time activity. Full instructions are provided, together with the required SQL code and full list of error codes and descriptions in a CSV format in the application’s installation directory, %ProgramFiles%\SMSAgent\ConfigMgr Deployment Reported\Error_Codes.
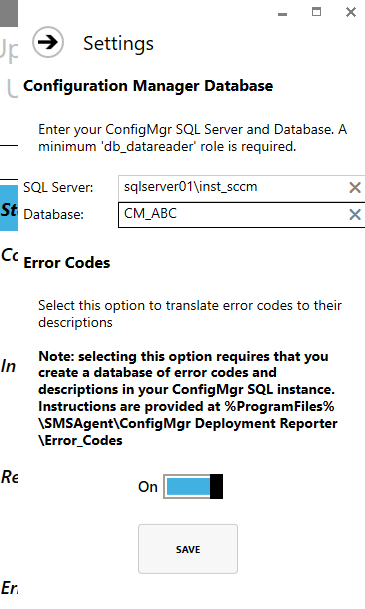
Once you have set these options, click Save to store them in the registry.
Using the Application
First of all, find the deployment you wish to report on by selecting the relevant tab, ie Applications, Standard Packages etc. A red box will highlight the first drop-down box which contains the list of applications or packages etc in your ConfigMgr environment. Lets choose Applications as an example.

Once you have selected the relevant application, select the relevant collection from the Targeted Collection drop-down box. Finally, choose which deployment type you wish to report on. The deployment results will then be loaded into the application.
The Deployment Tab
The Deployment tab contains information about that deployment, such as the number of assets targeted in that collection, the time the deployment was created, the enforcement deadline etc. The Applicable Systems field contains all systems that have or have not reported status for the deployment, where this deployment type is relevant to the system. The Unknown Systems fields contains the number of systems for which no deployment status has been returned to ConfigMgr, and is split between active and inactive systems, to help identify assets that should have reported status but have not (indicating a possible issue on the client), and systems that are not currently active.
This tab also contains summary data with the number and percentage of assets in their various compliance states.
The Compliance State Tabs
Clicking on the Compliant, In Progress etc tabs will give you the full list of assets that have reported that compliance state for the selected deployment. This makes it easy to identify which machines are compliant or non-compliant.
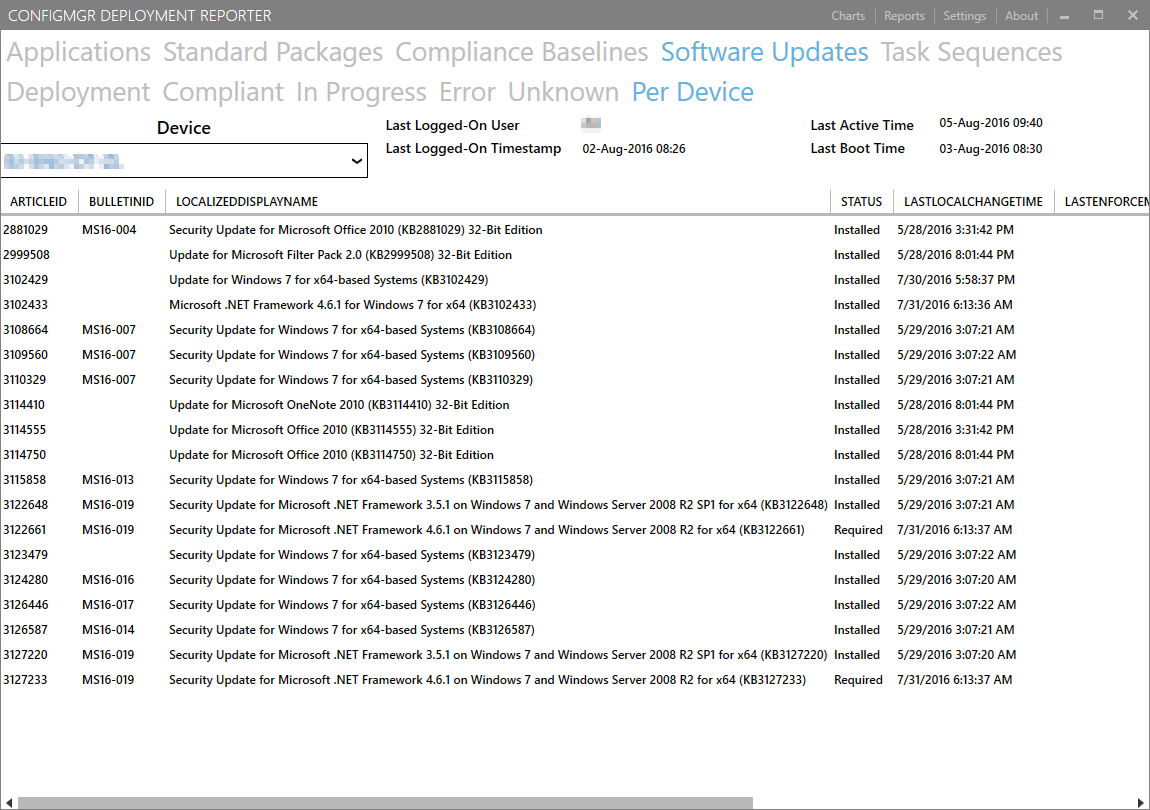
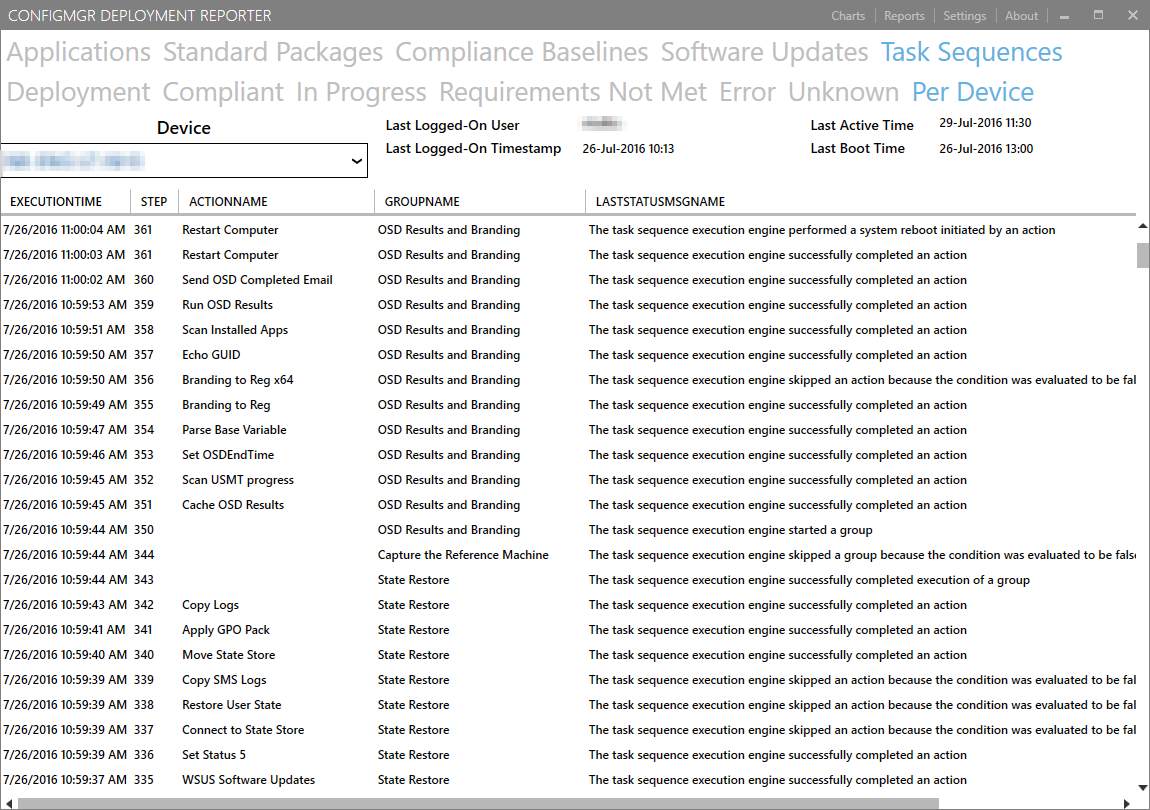
Per Device Tabs
The Software Updates and Task Sequences tabs contain an additional sub-tab called Per Device. This allows you to see more specific results for a particular system.
In the Software Updates Per Device tab, you can select a device that has been targeted by the deployment and view which software updates were applicable to that system from the updates in the deployment, and the status of each update. You can also view some additional metadata such as the last-logged on user, the time the system was last active or booted etc.
For Task Sequences, this tab will display the results of each step in the task sequence for the selected device.
Charts
To display the deployment results in a pie chart, simply populate the application with the deployment data, then select the Charts menu at the top right. You can generate a chart for applicable systems or reporting systems.

HTML Report
To generate a nice deployment overview in HTML format, populate the application with deployment data then select the Reports menu and click HTML Report. This snapshot report can be saved in HTML format or printed to PDF and sent to management or interested parties, or hosted on a corporate web site for example.
Export to CSV
Compliance data can be exported to CSV format to allow easy searching or filtering of results, or facilitate the creation of custom reports. Simply populate the application with deployment data, select any tab that contains a datagrid with results, then click Export to CSV from the Reports menu.