In this blog I’m documenting some of my experiences and recommendations for dealing with high load and concurrent invocations in Azure Functions – specifically for PowerShell functions. It’s not exhaustive and if you have some recommendations of your own, please do comment.
I use Azure functions quite a bit for things like serverless APIs, reporting flows and automation, mostly in PowerShell. When designing an Azure function, you need to think about the kind of load that function will be subject to, are there other functions in the same function app that could contribute to the overall load, and are there likely to be multiple simultaneous invocations, ie functions being triggered more than once around the same time. If your functions are not subject to high load there isn’t much to be concerned with here, but when load is high, or has the potential to be at certain times of the day for example, you need to design for scale and concurrency.
There’s no one-size-fits-all approach though and how you deal with load and concurrency really depends on things like what your functions are doing, how long they take to execute, how they are triggered, whether they are returning a response (as with an http trigger for an API), what plan your app is using, how much you’re willing to spend etc. It’s worth noting that enabling concurrency may not be appropriate in every scenario, for example you may be sending to a backend service where requests can only be processed sequentially.
I want to focus on 3 areas here:
- Function app concurrency and scaling options
- Strategies to avoid or distribute high load
- Monitoring your functions for load
Function app concurrency and Scaling options
For a PowerShell function, there are no concurrency options set out of the box. Therefore during times of high load, your requests may get queued as they can only process sequentially. If you’re using Application Insights and logging your traces, you can run the following KQL query to see if this is happening:
traces
| where message has "queuing requests"
| order by timestamp

The above is an example of when there was a spike in requests coming in around the same time and getting queued because no concurrency options were set. For an http-triggered function, you need to be mindful of the load balancer timeout, and an http request may be expecting a timely response from your function app in which case request queuing is something you want to avoid.
To configure concurrency, ie allowing multiple invocations to run simultaneously instead of sequentially, have a read of Microsoft’s advice here.
To briefly summarize, there are two application settings to use:
- FUNCTIONS_WORKER_PROCESS_COUNT
PSWorkerInProcConcurrencyUpperBound
Both of these options will increase the CPU and memory usage on each instance in your app; the first setting more than the second. You also have to think about which plan you are using here, because whichever values you set, you cannot exceed the CPU and memory limits of your plan.
The first setting configures the number of worker processes that can be used – per instance, while the second configures the number of runspaces that can be created within each worker process. Each runspace can execute its own invocation. So you can configure a combination of these for maximum effect, for example allow 2 worker processes and 10 runspaces in each process.
Scaling also has an impact here. If your function app scales out under load, it will create new instances and these settings will apply to each new instance also, which has memory and CPU implications, and therefore cost implications.
Some things to consider:
- Don’t add more worker processes than you really need because they will increase base memory usage.
- Be aware of state when using multiple runspaces. Because runspaces exist within the same process they may share state which could create unexpected results during simultaneous invocations.
- If your function does some initial work when starting up, such as executing code in the profile.ps1, this can add latency to the first invocation in every new runspace, process or instance. For example, if you deploy your function using VS Code and use the default profile.ps1 code to authenticate with Azure AD as a managed identity, this can take a few seconds to execute and therefore adds latency to the invocation. If you don’t need this code to run for every execution, remove the code from profile.ps1 to minimise the latency.
- For http triggered functions, you may also consider using the dynamicThrottlesEnabled, maxConcurrentRequests and maxOutstandingRequests configuration settings in your host.json file to control concurrency and limit resource usage and queuing as documented here.
- If your function calls an external or ‘downstream’ service, how does that service handle concurrency? Could it create latency when functions are executed concurrently?
- Some function triggers now support dynamic concurrency, which handles concurrency adjustments for you.
The consumption and premium plans both use event-driven auto-scaling and will add and remove additional instances based on the number of trigger events, which helps manage load and resource utilization. Bear in mind with the consumption plan new instances are not warm meaning there will be some additional latency as those instances start up. If your plan supports it, consider increasing the number of Always Ready instances to eliminate any start-up latency.
The concurrency values and scaling options you employ really depend on the profile of your solution and will likely be different between function apps. You have to monitor your function app to understand its load and scaling activities and use trial and error to find what works best for you.
As an example, I have one function app where a particular function could take 5-6 seconds to execute, has a high load at certain times of the day, and the rest of the time has a steady stream of invocations but there could be anything from seconds to minutes in between. After monitoring and some trial and error I settled on having 2 worker processes, up to 10 runspaces and 2 always ready instances in a premium plan and this seemed to provide a good balance between cost and reduced latency at load. Regular monitoring is very helpful here especially if usage patterns change and adjustments need to be made.
Strategies to avoid or distribute high load
As well as concurrency and scaling options, there are ways to reduce the load on your functions but which ones you can use really depend on the architecture of your solution.
Durable functions
If your function executions can take a long time, using durable functions may be a good fit. If you’ve ever requested an export job from Microsoft Intune using Microsoft Graph for example, you know that it can take some time before the job finishes and the results are available to download, but the initial request to create the job does not sit and wait for it to finish. Instead, you create the request, then periodically poll another endpoint to get the status of the request, then finally get a download URL when it is complete. Durable functions support this model and means your initial request has minimal execution time and therefore reduces load and has less requirement for concurrency.
Randomized SEND times
If your architecture allows it, you could consider adding some randomization to when requests get sent to your function app so that your function isn’t overloaded with many requests at one time.
For example, I have a Proactive remedations script in Intune that workstations run every day. The schedule is daily at 01:00. While most workstations get shut down at night, which means the PR script will generally run at start up / log on in the morning (which creates a natural randomization), there are a number of workstations that remain online overnight. At 01:00, these all hammer the function app at the same time and create a big spike in load. To mitigate this, I simply added some code at the beginning of the PR script to randomize the start time over 15 minutes and this effectively distributed the requests over a longer period.
$now = [datetime]::UtcNow
If ($now.Hour -eq 01 -and $now.Minute -lt 10)
{
    Start-Sleep -Seconds (Get-Random -Minimum 1 -Maximum 900)
}
Azure Queue storage
For one-way requests to an Azure function where you aren’t expecting an immediate response, you could use Azure Queue storage. Send the request to the storage queue and use a queue trigger on the function app. This allows the function app to work through the queue as it has bandwidth to do so without requiring high concurrency.
A limitation here though is the request can be a maximum of 64KB in size.
Azure Event Grid
Azure Event Grid can handle very high throughput and can be used as a broker between your sender and the function app. I have used this a number of times in simple reporting flows, where a client may send status messages as it executes a workload, like a feature update installation, or device provisioning activities. The event grid sends the event message to the function app via a subscription and the function injects the message into an Azure SQL database.
With this architecture, I have not needed to enable concurrency at all as the event grid effectively handles the incoming load with its retry policy. If a message cannot be received by the Azure function immediately, it will retry until it can. Should it exceed the retry policy the event will be dead-lettered and sent to an Azure storage account, and you can use Azure Monitor alerts to get notified of dropped events, should they ever happen.
With event grid, you can send messages up to 1MB in size.
Batch Processing
Another option is to code your function to process a batch of requests at one time in a pull model rather than a reactive trigger model, again if your architecture allows it. This can useful when you have a high number of requests that don’t require immediate processing.
For example, I created a solution where workstations gather inventory data and send these as JSON files into an Azure storage container. An Azure function (admittedly this one is coded in C# to take advantage of asynchronous programming!) runs on a timer trigger every 5 minutes, downloads all the inventory files currently in the container and using table-valued parameters batch-processes these into an Azure SQL database. This is extremely efficient and can process 100 inventory records in around 5 seconds; most of that time is spent actually downloading the blobs; the SQL work takes milliseconds.
Because the function invocations only occur once every 5 minutes the function app has minimal CPU and memory usage, and therefore minimal cost, zero concurrency requirement and never needs to scale out.
Using an Azure storage account to receive the data initially allows for much greater data sizes to be sent than queue storage or event grid.
Load balancing
A more costly option to explore is load-balancing the functions. Ie, you create one or more identical functions and function apps, and use a frontend service or some other mechanism to distribute requests between them. This could also be used for high-availability where your function apps reside in different Azure regions, for example.
For http triggered functions, consider using Azure Front Door.
Monitoring functions for load and concurrency
Monitoring your Azure functions is important to understand their load profile and for determining your ongoing concurrency requirements. It’s highly recommended to enable Application Insights on your function app as it provides a wealth of useful insights.
Usually when creating a solution that uses Azure resources I will create an Azure Dashboard for monitoring key metrics for those resources in a single place, enabling me easily see the general health of those resources and the solution they support.
Diagnostic reports
Before we look at metrics and logs though, there are some super-useful resources hidden away in the Diagnose and solve problems blade of your function app.
For example, click the Configuration and Management category, and look at the All Scaling Operations report, where you can see how often your app is getting scaled in and out.

In the Availability and Performance category, there are a number of useful reports. For example, the Function Cold Start report reveals how much latency you’re getting when new instances are started up on the Consumption plan.

Also check out the Memory analysis, High CPU Analysis and Function Execution Performance reports. In the latter, the Function Response Time chart can help you identify unwanted spikes in latency, and the Function Executions chart helps with understanding load and shows how many requests are being processed and when.


Also check out the HTTP 4xx Errors report. Here you can see any 429 errors on the web workers. These seem to correlate with the “Possible thread pool starvation detected” concurrency warnings in the trace logs and probably indicate periods of high load or high resource usage when the app needs to scale out.


Metrics
There are a number of useful metrics available that you can add to an Azure Dashboard if you wish. Below I’m looking at the Server requests metric where you’ll see the same pattern as the Function Executions chart we saw earlier in the Diagnostic reports.

Other useful metrics include (note some metrics are very similar between the namespaces):
| Resource type | Metric namespace | Category | Metric |
|---|---|---|---|
| Application insights | Application Insights standard metrics | Failures | Failure requests |
| Performance counters | Available memory | ||
| Process CPU | |||
| Process IO rate | |||
| Process private bytes | |||
| Server | Server requests | ||
| Server response time | |||
| Log-based metrics | Performance counters | Process CPU (all cores) | |
| Function app | App Service standard metrics | <default> | Average memory working set |
| Data In/Out | |||
| Function Execution Count | |||
| Requests | |||
| App Service plan | App Service plan standard | <default> | CPU percentage |
| Memory percentage |
Log Analytics
You can run your own queries against the Application Insights workspace to pull data as you want to see it. You can also add these to an Azure Dashboard using the Pin to > Azure dashboard option.
Below are some examples.
This query shows how many times per hour a new host is started up and gives an indication of how often your app is scaling out.
traces
| where message startswith "Host started"
| summarize count() by bin(timestamp,1h)
| project timestamp,count_
| order by timestamp desc
| render columnchart
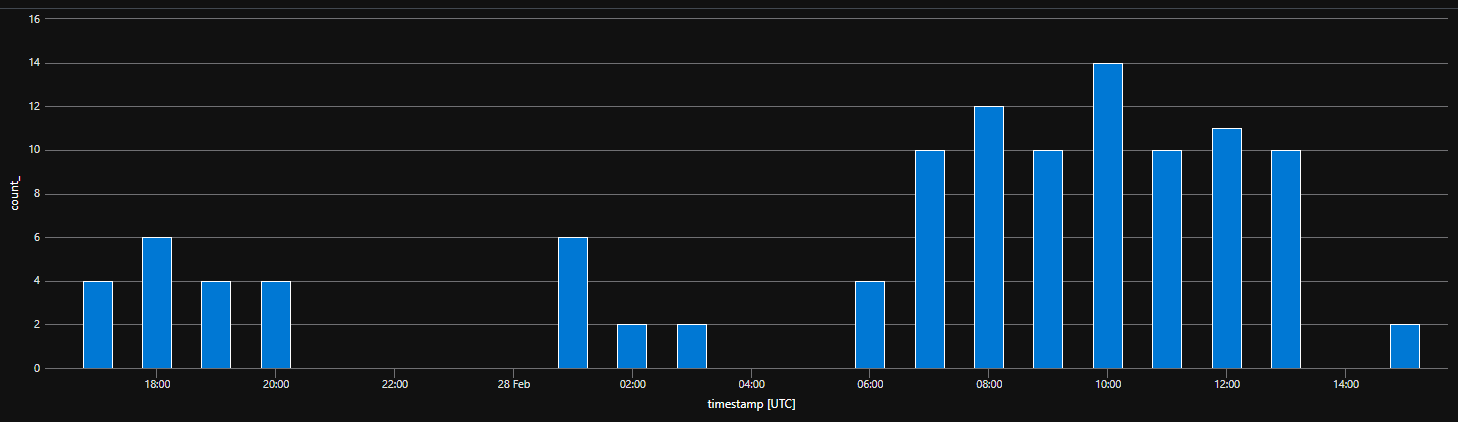
This one is similar but shows how many times per hour new worker processes are getting added. Remember you’ll have worker processes per instance based on what you have defined in the FUNCTIONS_WORKER_PROCESS_COUNT app setting,
traces
| where message startswith "Worker process started and initialized"
| summarize count() by bin(timestamp,1h)
| project timestamp,count_
| order by timestamp desc
| render columnchart

If you’ve enabled Scale controller logs, you can query for how many instances are running over time. In this case I’m using filtering for the Production slot as I’m using multiple deployment slots.
traces
| where message == "Instance count changed"
| where customDimensions["SlotName"] == "Production"
| extend ["Instance count"] = customDimensions["CurrentInstanceCount"]
| summarize by timestamp,toint(["Instance count"])
| order by timestamp desc
| render timechart

This query will show when a host’s CPU has exceeded it’s threshold and is a clear indicator of high load:
traces
| where message startswith "[HostMonitor] Host CPU threshold exceeded"
| extend
    Category=customDimensions["Category"],
    EventName=customDimensions["EventName"],
    HostInstanceId=customDimensions["HostInstanceId"],
    LogLevel=customDimensions["LogLevel"],
    ProcessId=customDimensions["ProcessId"]
| project
    timestamp,
   message,
    severityLevel,
    cloud_RoleInstance,
    itemId,
    Category,
    EventName,
    HostInstanceId,
    LogLevel,
    ProcessId
| order by timestamp desc

You can view the requests log to see individual requests, the result codes, execution duration, location etc (this is for the http trigger)
requests
| project timestamp, name, success, resultCode, duration=duration/1000, performanceBucket,client_City,client_StateOrProvince,client_CountryOrRegion
| sort by timestamp desc

If your function app has a profile.ps1 which includes the default code to authenticate as the managed identity with Azure AD, you can observe when this is being executed, and whether it’s being executed in a new runspace or worker process. These invocations will have additional latency while they run the profile.ps1 code.
This query will return each occurence:
traces
| where message startswith "OUTPUT: MSI@"
| project
    timestamp,
    message,
    cloud_RoleInstance,
    HostInstanceId=customDimensions["HostInstanceId"],
    ProcessId=customDimensions["ProcessId"],
    operation_Name,
    client_City,
    client_StateOrProvince,
    client_CountryOrRegion
| order by timestamp desc

Or you can also display this as a chart:
traces
| where message startswith "OUTPUT: MSI@"
| summarize ["Profile.ps1 execution count"]=count() by bin(timestamp,1m)
| order by timestamp desc
| render columnchart

During times of high load it can be useful to use the Live metrics feature of Application Insights to view requests as they come in and monitor your app’s resources in real-time.

You can also get some useful at-a-glance stats from the Performance blade

Summary
Armed with this information hopefully you can perform appropriate monitoring for your PowerShell Azure functions and make the right design decisions and adjustments to handle your incoming load with minimal latency.