Howdy folks!
I created a Power BI report recently that lets you view the connectivity status of your ConfigMgr clients and I thought I would share it with the community.
The report shows devices that are online/offline, which management point they are using, which access management point they are connecting with, whether they are internet connected through a CMG or on the corporate network, boundary groups as well as time charts for online/offline devices and CMG/intranet devices.
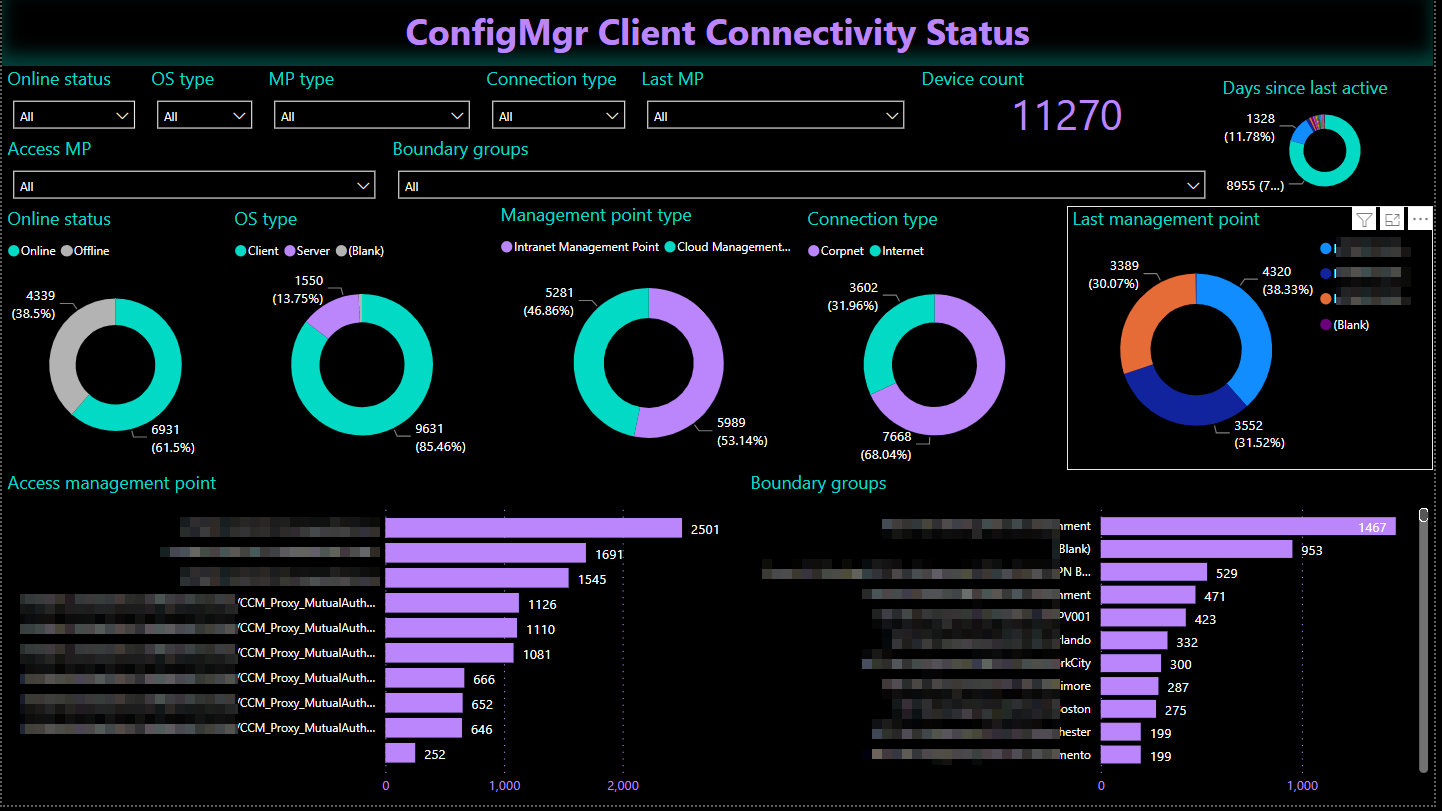

The filters on the first page filter the both the charts on the first page and the list of devices on the second page.
For the time charts, you can filter by management point and you can use the slider to zoom in to a particular time period.
Download the report template here.
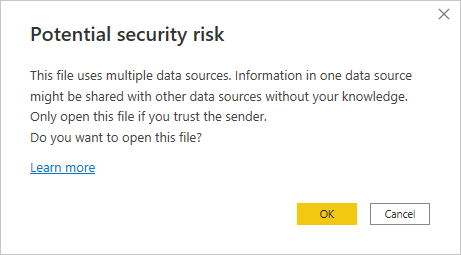
Open opening, because the report uses Direct Query (more on that in a sec) you may see the following prompt – click OK.
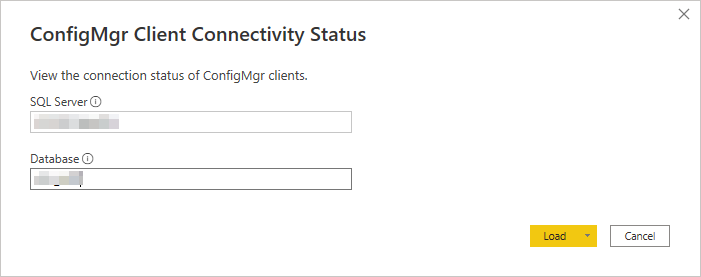
Enter your ConfigMgr SQL server and database names:
The report uses Direct Query which essentially accesses live data and is preferred if you always want to see the current status. However there is a performance hit with this mode and visualizations will take longer to refresh while data changes are loaded in.
You can switch to Import mode if you prefer, which isn’t live data but is more responsive and can be used with a refresh schedule in the Power BI service.
In the bottom right of the report in Power BI desktop, click to change the storage mode:

You’ll receive a warning:
