So I’m not a big Twitter fan, but I do admit – as an IT professional you can find a lot of useful and pertinent information there. One example was this morning when I happened to notice a tweet from Microsoft about their opensource projects on Github. After a quick perusal, I happened across an interesting project called Interactive Data Display for WPF. According to its description:
Interactive Data Display for WPF is a set of controls for adding interactive visualization of dynamic data to your application. It allows to create line graphs, bubble charts, heat maps and other complex 2D plots which are very common in scientific software. Interactive Data Display for WPF integrates well with Bing Maps control to show data on a geographic map in latitude/longitude coordinates. The controls can also be operated programmatically.
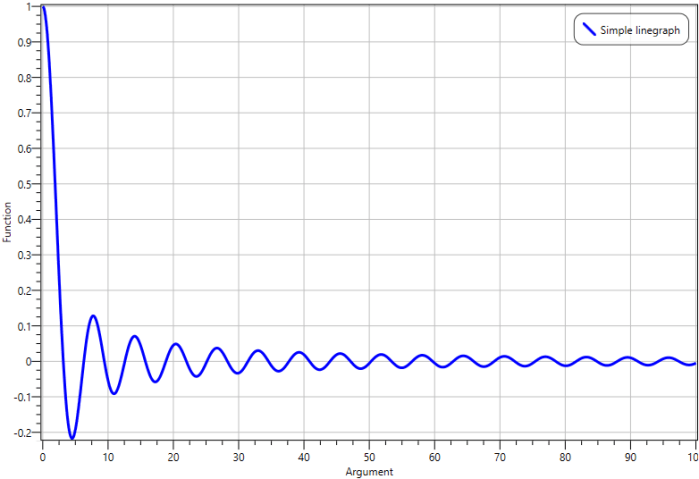
There are some nice-looking chart examples there such as:


Since there are no native charting controls in WPF this was of interest, so I fired up my PowerShell ISE and tried to get this working.
I created the following simple example using a bar chart. You can change the X or Y values then click Plot to update the chart.

The nice thing with this control is that it’s interactive – you can scroll the mouse wheel to zoom in and out, as well as move the axis left and right, and double-click to re-center.

Here’s the POSH code for the example:
This file contains hidden or bidirectional Unicode text that may be interpreted or compiled differently than what appears below. To review, open the file in an editor that reveals hidden Unicode characters.
Learn more about bidirectional Unicode characters
| ## Example of how to use the opensource InteractveDataDisplay module from Microsoft to create a WPF chart in PowerShell | |
| Add-Type -AssemblyName PresentationFramework | |
| Add-Type -AssemblyName System.IO.Compression.FileSystem | |
| # Location to download the required libraries and reference them from | |
| $Source = "C:\Users\tjones\OneDrive\PowerShell\POSH Projects\Interactive Data Display" | |
| #region DownloadDependencies | |
| $URLs = @( | |
| 'https://api.nuget.org/v3-flatcontainer/system.reactive.interfaces/3.1.1/system.reactive.interfaces.3.1.1.nupkg' | |
| 'https://api.nuget.org/v3-flatcontainer/microsoft.maps.mapcontrol.wpf/1.0.0.3/microsoft.maps.mapcontrol.wpf.1.0.0.3.nupkg' | |
| 'https://api.nuget.org/v3-flatcontainer/system.reactive.windows.threading/3.1.1/system.reactive.windows.threading.3.1.1.nupkg' | |
| 'https://api.nuget.org/v3-flatcontainer/system.reactive.platformservices/3.1.1/system.reactive.platformservices.3.1.1.nupkg' | |
| 'https://api.nuget.org/v3-flatcontainer/system.reactive.core/3.1.1/system.reactive.core.3.1.1.nupkg' | |
| 'https://api.nuget.org/v3-flatcontainer/interactivedatadisplay.wpf/1.0.0/interactivedatadisplay.wpf.1.0.0.nupkg' | |
| 'https://api.nuget.org/v3-flatcontainer/system.reactive/3.1.1/system.reactive.3.1.1.nupkg' | |
| 'https://api.nuget.org/v3-flatcontainer/system.reactive.linq/3.1.1/system.reactive.linq.3.1.1.nupkg' | |
| ) | |
| Foreach ($URL in $URLs) | |
| { | |
| $SubfolderName = $($URL.Split('/') | Select -Last 1).trimend('.nupkg') | |
| If (!(Test-Path $Source\$SubfolderName)) | |
| { | |
| # Download file | |
| $Output = "$Source\$($URL.Split('/') | Select -Last 1)" | |
| Invoke-WebRequest -Uri $URL -OutFile $Output | |
| # Create directory | |
| $null = New-Item -Path $Source -Name $SubfolderName -ItemType Directory -Force | |
| # Extract to directory | |
| [System.IO.Compression.ZipFile]::ExtractToDirectory( $Output, "$Source\$SubfolderName" ) | |
| # Cleanup nupkgs | |
| Remove-item -Path $Output -Force | |
| } | |
| } | |
| #endregion | |
| # Add the required libraries | |
| Add-Type -Path "$Source\microsoft.maps.mapcontrol.wpf.1.0.0.3\lib\net40-Client\Microsoft.Maps.MapControl.WPF.dll" | |
| Add-Type -Path "$Source\System.Reactive.Interfaces.3.1.1\lib\net45\System.Reactive.Interfaces.dll" | |
| Add-Type -Path "$Source\System.Reactive.Core.3.1.1\lib\net45\System.Reactive.Core.dll" | |
| Add-Type -Path "$Source\System.Reactive.Linq.3.1.1\lib\net45\System.Reactive.Linq.dll" | |
| Add-Type -Path "$Source\System.Reactive.PlatformServices.3.1.1\lib\net45\System.Reactive.PlatformServices.dll" | |
| Add-Type -Path "$Source\System.Reactive.Windows.Threading.3.1.1\lib\net45\System.Reactive.Windows.Threading.dll" | |
| Add-Type -Path "$Source\InteractiveDataDisplay.WPF.1.0.0\lib\net452\InteractiveDataDisplay.WPF.dll" | |
| # Define the UI in xaml | |
| [XML]$Xaml = @' | |
| <Window | |
| xmlns="http://schemas.microsoft.com/winfx/2006/xaml/presentation" | |
| xmlns:x="http://schemas.microsoft.com/winfx/2006/xaml" | |
| xmlns:d3="clr-namespace:InteractiveDataDisplay.WPF;assembly=InteractiveDataDisplay.WPF" | |
| Title = "InteractiveDataDisplay Bar Chart Example" SizeToContent="WidthAndHeight" MinHeight="450" MinWidth="450" WindowStartupLocation = "CenterScreen" ResizeMode="NoResize" > | |
| <Grid> | |
| <StackPanel Orientation="Vertical"> | |
| <StackPanel Orientation="Horizontal" HorizontalAlignment="Center"> | |
| <Label Content="X Axis" FontSize="16"/> | |
| <TextBox Name="X1" Text="1" VerticalContentAlignment="Center" HorizontalContentAlignment="Center" Width="30" FontSize="16" Margin="5"/> | |
| <TextBox Name="X2" Text="2" VerticalContentAlignment="Center" HorizontalContentAlignment="Center" Width="30" FontSize="16" Margin="5" /> | |
| <TextBox Name="X3" Text="3" VerticalContentAlignment="Center" HorizontalContentAlignment="Center" Width="30" FontSize="16" Margin="5" /> | |
| <TextBox Name="X4" Text="4" VerticalContentAlignment="Center" HorizontalContentAlignment="Center" Width="30" FontSize="16" Margin="5" /> | |
| <TextBox Name="X5" Text="5" VerticalContentAlignment="Center" HorizontalContentAlignment="Center" Width="30" FontSize="16" Margin="5" /> | |
| </StackPanel> | |
| <StackPanel Orientation="Horizontal" HorizontalAlignment="Center"> | |
| <Label Content="Y Axis" FontSize="16"/> | |
| <TextBox Name="Y1" Text="5" VerticalContentAlignment="Center" HorizontalContentAlignment="Center" Width="30" FontSize="16" Margin="5"/> | |
| <TextBox Name="Y2" Text="4" VerticalContentAlignment="Center" HorizontalContentAlignment="Center" Width="30" FontSize="16" Margin="5" /> | |
| <TextBox Name="Y3" Text="3" VerticalContentAlignment="Center" HorizontalContentAlignment="Center" Width="30" FontSize="16" Margin="5" /> | |
| <TextBox Name="Y4" Text="2" VerticalContentAlignment="Center" HorizontalContentAlignment="Center" Width="30" FontSize="16" Margin="5" /> | |
| <TextBox Name="Y5" Text="1" VerticalContentAlignment="Center" HorizontalContentAlignment="Center" Width="30" FontSize="16" Margin="5" /> | |
| </StackPanel> | |
| <Button Name="Plot_Button" Content="Plot" Height="50" Width="100" HorizontalAlignment="Center" FontSize="32" Foreground="green" Margin="5"/> | |
| <d3:Chart Name="plotter" Height="430" Width="430"> | |
| <d3:Chart.Title> | |
| <TextBlock HorizontalAlignment="Center" FontSize="18" Margin="0,5,0,5">Enter plot values</TextBlock> | |
| </d3:Chart.Title> | |
| <d3:BarGraph Name="barChart" Color="Blue" Height="430" Width="430" /> | |
| </d3:Chart> | |
| </StackPanel> | |
| </Grid> | |
| </Window> | |
| '@ | |
| # Load all the named objects into items in a hashtable | |
| $Hash = [hashtable]::Synchronized(@{}) | |
| $Hash.Window = [Windows.Markup.XamlReader]::Load((New-Object -TypeName System.Xml.XmlNodeReader -ArgumentList $xaml)) | |
| $XAML.SelectNodes("//*[@*[contains(translate(name(.),'n','N'),'Name')]]") | ForEach-Object -Process { | |
| $Hash.$($_.Name) = $Hash.Window.FindName($_.Name) | |
| } | |
| # Handle the Button click event | |
| $Hash.Plot_Button.Add_Click({ | |
| # Plot the chart | |
| $Hash.barChart.Plot(@( | |
| $Hash.X1.Text,$Hash.X2.Text,$Hash.X3.Text,$Hash.X4.Text,$Hash.X5.Text | |
| ),@( | |
| $Hash.Y1.Text,$Hash.Y2.Text,$Hash.Y3.Text,$Hash.Y4.Text,$Hash.Y5.Text | |
| )) | |
| }) | |
| # Display the window | |
| $null = $Hash.window.Dispatcher.InvokeAsync{$Hash.window.ShowDialog()}.Wait() |
There are a number of dependency libraries that the script will download for you, or you can also install them via the NuGet gallery as indicated in the project’s readme.
This is just a quick demo, but it’s a pretty cool control!
Receiving the following error:
Exception calling “Load” with “1” argument(s): “Cannot create unknown type ‘{clr-namespace:InteractiveDataDisplay.WPF;assembly=InteractiveDataDisplay.WPF}Chart’.”
I’m not familiar with loading assemblies from here strings so not sure what to check. i did verify that allow of the library files existed at the correct paths.
Do you have .Net 4.5.2 minimum?
Another you might look at is https://github.com/beto-rodriguez/Live-Charts